The FINITE community once again got together to share insights and level-up their marketing. This time, we wanted to tackle an analytics challenge that helps our members measure their activity.
The FINITE community is the private, global community for B2B marketers in technology and SaaS companies. This event was produced in collaboration with Clarity, the global marketing and communications agency.
Our guest speakers were Phil Wade and Jordan Phillipps from Clarity, and experts in marketing analytics. They’ve worked on clients like Aon, Invesco, Janus Henderson and more.
The session focused on addressing what they termed the “CFO problem” – demonstrating the tangible financial impact of content marketing to business stakeholders. This can help attain buy-in from execs and secure further investment for content marketing.
Here are the key takeaways:
Understanding the CFO Problem
- CFO Perspective: CFOs often equate marketing value directly with revenue generated. Unlike Pay-Per-Click advertising with clear ROI metrics, content value can seem elusive because its impacts aren’t always direct or immediate.
- Content Impact: Web pages and blog posts might not immediately result in conversions, but they play a significant role in the customer journey, influencing future sales.
Solving the Content Measurement Challenge
- User Journey Analysis: To overcome the limitation of session-level data (as seen in Google Analytics), the focus shifts to understanding full user journeys, including post-website interaction conversions tracked in CRM systems.
- Integrating CRM and Web Data: Combining CRM data, where final sales data is stored, with web analytics to track user journeys allows marketers to measure content’s contribution to revenue.
Technique: Content Value Measurement
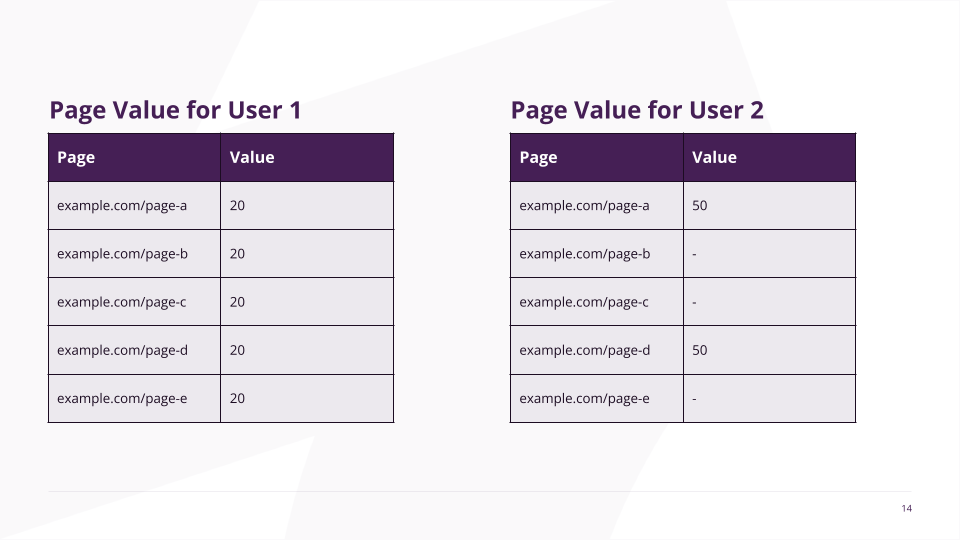
- Backward Analysis from Conversion: Start with conversions and analyze all content touched by users on their journey.
- Assigning Value to Content: By dividing the conversion value by the number of content pages viewed by the user, each piece of content receives a proportional value based on its contribution to sales.
Using Data for Strategic Planning
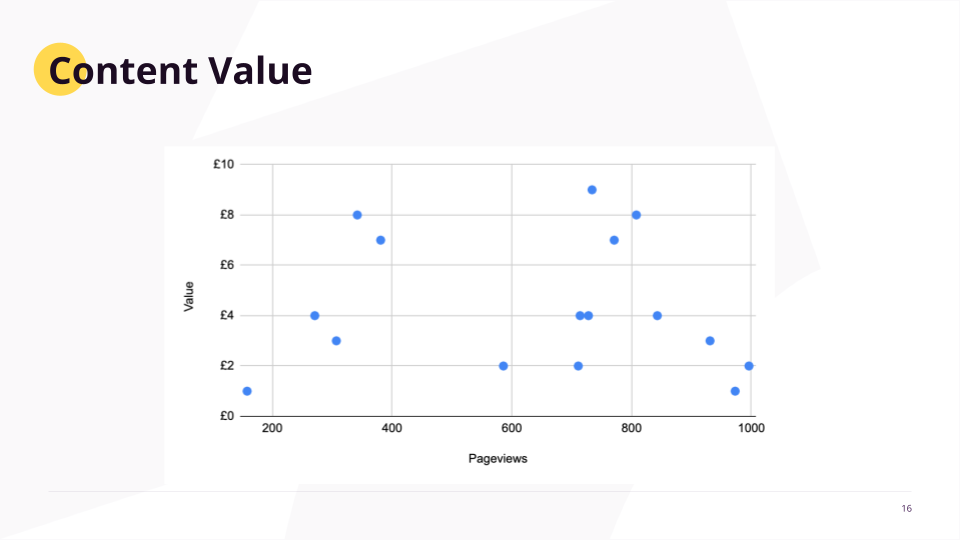
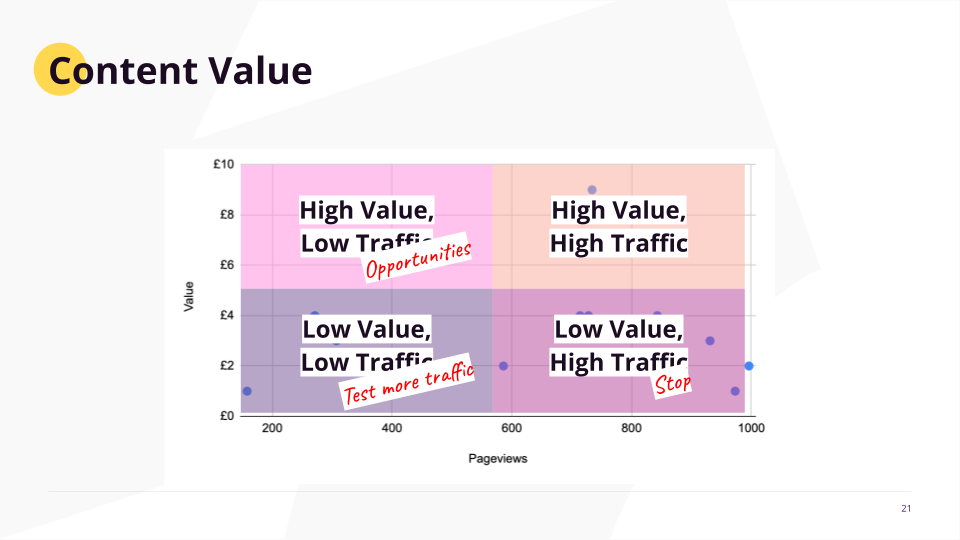
- Content Value Chart: Combining metrics like content value and page views allows for visual analysis.
- Actionable Insights from Quad Charts:
- High Value, High Traffic: Maintain and monitor content here as it effectively contributes to conversions.
- High Value, Low Traffic: Drive more traffic to this content to capitalize on its conversion potential.
- Low Value, High Traffic: Consider revising or discontinuing underperforming content that attracts viewers but lacks conversion value.
- Low Value, Low Traffic: Experiment with driving more traffic to see if this could increase value.
Technical Considerations
- Leveraging Google Analytics 4 and BigQuery: Exporting web data to BigQuery, allows for detailed analysis and integration with CRM sales data, overcoming the session data limitation.
- Data Warehousing: Use BigQuery to store and analyze both web and CRM data, creating a robust framework for ongoing content analysis.
Benefits and Implementation
- Simple, Scalable, and Effective: This method not only answers the question of content ROI but provides strategic guidance for content planning – all within an accessible framework.
- Empowering Content Teams: The ease of interpretation enables marketing teams to integrate this analysis tool into regular strategic discussions without needing an analyst’s oversight.
Through these discussions, Phil and Jordan highlighted how understanding and proving the commercial value of content is pivotal for earning the buy-in needed to grow marketing budgets and initiatives. By applying these strategies, marketers can not only justify their current content strategies but also optimize future content for maximum impact.
